
Greenshift Chart – WordPress Gutenberg Data Visualization & Chart Builder Plugin
Verified from VirusTotal 100% Original Product and Virus Free. Free New Version Lifetime On Single Purchase. Unlimited Website Usage Price is in US dollars and included tax
Buy confidently with secure digital checkout, account-based downloads, and a cleaner WPPlugShop product experience.
Preview Greenshift Chart – WordPress Gutenberg Data Visualization & Chart Builder Plugin
View the product artwork, switch gallery images, and open a larger preview before checkout.
Get secure digital access for real WordPress projects
This section summarizes the buying experience and what customers can expect after checkout.
Product overview, benefits, and digital access details
Review the key product details, practical use cases, and digital access information before checkout.
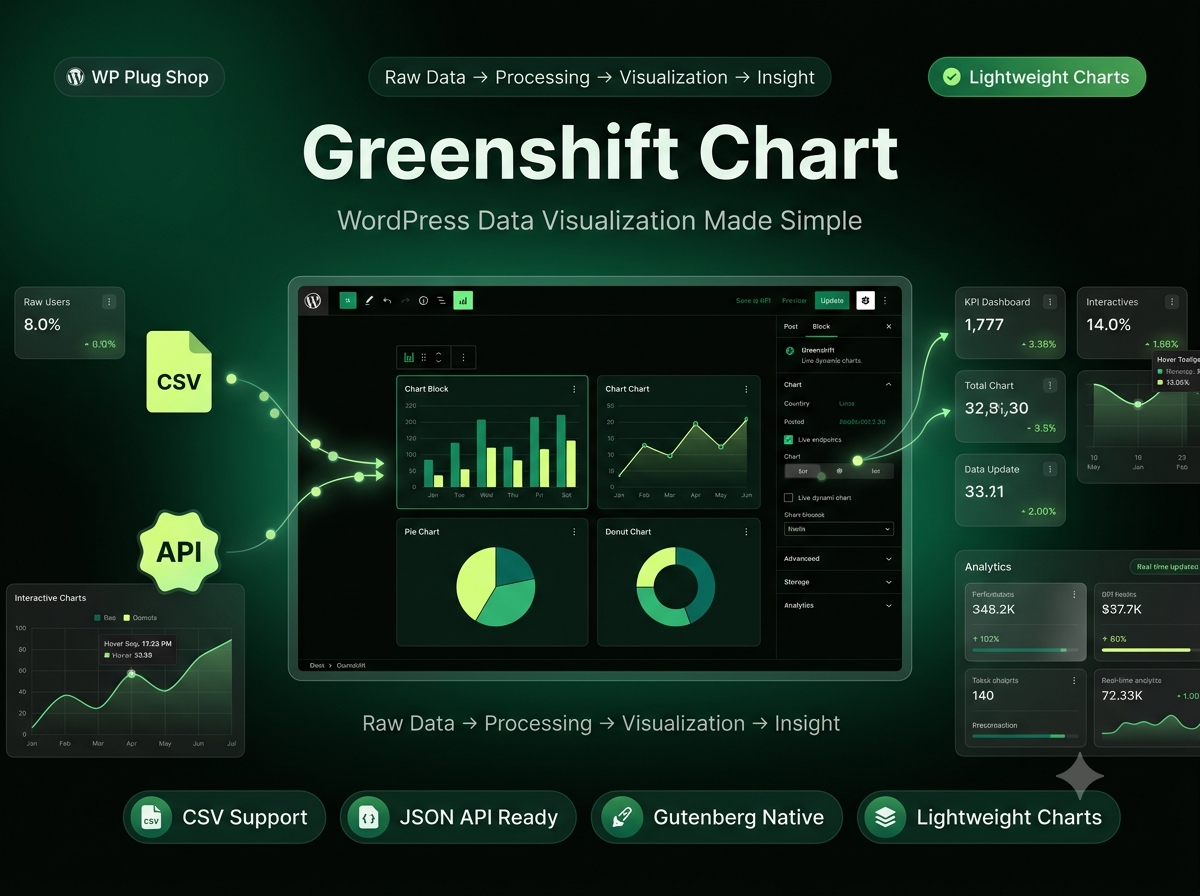
Product Overview
Greenshift Chart is a powerful Gutenberg-native data visualization plugin for WordPress that allows you to create interactive charts and graphs directly inside the block editor. It transforms raw data into clear, visually engaging insights using bar charts, line charts, pie charts, donut charts, radar charts, scatter plots, and more.
Designed for performance and flexibility, Greenshift Chart supports dynamic data sources such as CSV files, JSON structures, REST APIs, WordPress queries, and custom field integrations. This makes it ideal for building dashboards, reports, and data-driven content without relying on external tools or heavy libraries.
It brings professional-grade data visualization into WordPress while maintaining a lightweight structure optimized for speed and Core Web Vitals.
Why This Product Is Useful
Most WordPress websites struggle to present data in a meaningful and visually appealing way. Traditional chart solutions are either too complex, require coding, or rely on external services that slow down performance.
Greenshift Chart solves this problem by offering a native Gutenberg chart builder that is both powerful and easy to use.
- Eliminates dependency on external charting tools
- Enables no-code data visualization inside WordPress
- Improves readability of complex data sets
- Enhances engagement through interactive visuals
- Supports dynamic and real-time data integration
- Optimized for fast loading and performance
Key Features
- Multiple Chart Types: Bar, line, pie, donut, radar, scatter, and area charts.
- CSV Data Support: Import and visualize data directly from CSV files.
- JSON & API Integration: Connect charts with dynamic JSON and REST API data sources.
- WordPress Query Support: Use WP data as chart input for dynamic content visualization.
- Interactive Tooltips: Hover-based insights for better data understanding.
- Responsive Design: Fully optimized for desktop, tablet, and mobile devices.
- Custom Styling Controls: Adjust colors, labels, legends, and grid layouts.
- Real-Time Data Updates: Support for auto-refreshing datasets.
- Gutenberg Native Block: Seamless integration inside WordPress editor.
- Lightweight Rendering Engine: Optimized for performance and Core Web Vitals.
Main Benefits
- Transforms complex data into easy-to-understand visuals
- Improves user engagement and content clarity
- Enhances business reporting and analytics presentation
- Enables professional dashboards inside WordPress
- Reduces need for external BI tools
- Supports data-driven storytelling
- Improves conversion-focused landing pages
- Works without coding knowledge
- Optimized for fast and scalable websites
- Helps build credibility through visual data representation
Best Use Cases
- Business performance dashboards
- WooCommerce sales analytics pages
- Marketing campaign reports
- Financial data visualization
- Survey and feedback result presentation
- SaaS KPI dashboards
- Educational data storytelling
- Blog-based statistical content
- Agency client reporting pages
- Real-time analytics dashboards
Who Should Use This Product?
- Data analysts working with WordPress dashboards
- Digital marketers tracking campaign performance
- WooCommerce store owners analyzing sales
- Agencies building client reporting systems
- SaaS founders visualizing KPIs
- Bloggers presenting research or statistics
- Educators explaining data concepts visually
- Developers building dynamic reporting systems
WP Plug Shop Access Benefits
WP Plug Shop provides access to premium WordPress-ready visualization tools designed for professionals who need fast, flexible, and reliable data presentation systems.
- Instant digital download access
- Secure checkout and delivery
- WordPress-compatible plugin package
- Optimized for real-world analytics use
- Cost-effective access for agencies and businesses
- Suitable for client reporting systems
Product Details
| Specification | Details |
|---|---|
| Product Name | Greenshift Chart |
| Category | WordPress Data Visualization Plugin |
| Plugin Type | Gutenberg Chart Block Addon |
| Primary Function | Interactive Charts & Graphs |
| Supported Data | CSV, JSON, REST API, WP Query |
| Use Case | Dashboards, Analytics, Reporting |
| Skill Level | No-Code Friendly |
| Optimization | Core Web Vitals Friendly |
| Rendering | Lightweight Dynamic Chart Engine |
Feature Comparison
| Feature | Greenshift Chart | Traditional Chart Plugins |
|---|---|---|
| Gutenberg Integration | Native | Limited |
| Performance Impact | Low | High |
| Dynamic Data Support | CSV, JSON, API | Often Limited |
| Customization | High | Medium |
| Real-Time Updates | Yes | Rare |
| No-Code Usage | Yes | Partial |
| Scalability | High | Medium |
Pros and Considerations
| Pros | Considerations |
|---|---|
| Lightweight and fast rendering | Best with Gutenberg-based workflows |
| Supports multiple data formats | Advanced dashboards may require planning |
| No-code chart creation | API integration setup needed for dynamic data |
| Perfect for analytics pages | Large datasets may need optimization |
| Improves data storytelling | Some features depend on GreenShift ecosystem |
Final Verdict
Greenshift Chart is a powerful and modern solution for adding professional data visualization capabilities to WordPress. It bridges the gap between complex analytics tools and simple WordPress content creation by enabling dynamic, interactive charts directly inside Gutenberg.
For businesses, marketers, and developers, it provides a scalable and performance-optimized way to present data in a visually compelling format that improves understanding, engagement, and conversions.
Quick product answers for buyers and AI search
Clear product answers help buyers, search engines, and AI answer engines understand this product faster.
Best ways to use this WordPress digital product
These use cases help buyers quickly decide if this product fits their workflow.
How digital access works
No physical shipping is required. This is a digital product access purchase designed for account-based downloads.
Secure payment options for digital checkout
WPPlugShop supports trusted checkout options so buyers can complete digital purchases with more confidence.
Frequently asked questions
Buyer-focused answers about digital access, secure payments, downloads, support, and product usage.
Related WordPress tools you may also like
Explore related WordPress tools that may support the same workflow, website type, or project goal.


Choose the right WordPress tool with confidence
Request a product, explore membership access, or contact support if you want help choosing the right WordPress digital product before checkout.