
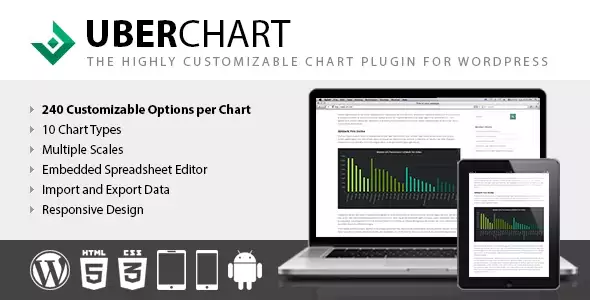
Product Overview
UberChart – WordPress Chart Plugin 1.35 is a powerful data visualization plugin that enables you to create responsive charts, graphs, and interactive data presentations directly within WordPress. With an intuitive spreadsheet-style editor and multiple chart types, you can transform raw data into clear, visually engaging reports without requiring coding knowledge.
Whether you’re displaying business analytics, financial reports, survey results, educational statistics, marketing performance, or scientific data, UberChart provides flexible tools to build professional charts that look great on any device.
Why Choose UberChart?
Presenting data in an easy-to-understand format is essential for improving user engagement and decision-making. UberChart simplifies the process by allowing you to build customizable charts and graphs from within your WordPress dashboard using a familiar spreadsheet interface.
- Create professional charts without coding.
- Visualize complex data clearly.
- Responsive charts for all devices.
- Spreadsheet-style data management.
- Multiple chart and graph types.
- Easy WordPress integration.
Key Features
- Interactive chart builder.
- Spreadsheet-style data editor.
- Multiple chart types.
- Responsive chart layouts.
- Custom colors and styling.
- Axis and legend customization.
- Animated chart rendering.
- Shortcode support.
- Data import and editing.
- Interactive tooltips.
- Performance optimized.
- Responsive design.
- Developer friendly.
- Translation ready.
- WordPress compatible.
- Easy administration.
- Professional data presentation.
- Business reporting support.
- Marketing analytics visualization.
- Flexible customization options.
Main Benefits
- Present data professionally.
- Improve content engagement.
- Enhance business reporting.
- Create interactive visualizations.
- Display analytics clearly.
- Support informed decision-making.
- Increase report readability.
- Save time with an intuitive editor.
Best Use Cases
- Business dashboards.
- Financial reporting.
- Marketing analytics.
- Sales performance tracking.
- Survey result visualization.
- Educational websites.
- Research publications.
- Corporate reporting.
- WooCommerce analytics.
- Data-driven blogs.
Who Should Use This Plugin?
- Business owners.
- Data analysts.
- Marketing professionals.
- Researchers.
- Financial consultants.
- Website developers.
- WooCommerce store owners.
- Educational institutions.
- Digital agencies.
- Content creators.
WP Plug Shop Access Benefits
WP Plug Shop provides professionally managed digital downloads for WordPress users seeking GPL-compatible plugins, themes, and development resources.
- Instant digital download after purchase.
- GPL-compatible digital resource.
- Secure checkout process.
- Files scanned before distribution.
- Suitable for developers, agencies, freelancers, and businesses.
- Fast access for WordPress projects.
Disclaimer: WP Plug Shop is an independent digital marketplace and is not the original developer of third-party products unless explicitly stated. Official licenses, developer support, automatic updates, UberChart licenses, and premium support are not included unless specifically mentioned.
Product Details
| Feature | Details |
|---|---|
| Product Name | UberChart – WordPress Chart Plugin |
| Version | 1.35 |
| Product Type | Premium WordPress Data Visualization Plugin |
| Platform | WordPress |
| Primary Function | Create Charts & Graphs |
| Interface | Spreadsheet-Style Chart Builder |
| Output | Responsive Interactive Charts |
| Ideal For | Businesses, Analysts, Educators, Agencies & Developers |
Feature Comparison
| Capability | Static Images | UberChart |
|---|---|---|
| Interactive Charts | No | Yes |
| Responsive Display | Limited | Yes |
| Spreadsheet Data Editing | No | Yes |
| Multiple Chart Types | Limited | Yes |
| Custom Styling | No | Yes |
| Shortcode Integration | No | Yes |
| Interactive Tooltips | No | Yes |
| Easy Data Management | Basic | Advanced |
Pros & Considerations
| Pros | Considerations |
|---|---|
| Create interactive charts without coding. | Requires manual data entry or updates. |
| Responsive charts for all screen sizes. | Complex datasets may require additional planning. |
| Spreadsheet-style interface simplifies chart creation. | Chart appearance may require styling to match your theme. |
| Suitable for business, education, and analytics. | Users should choose chart types appropriate for their data. |
| Professional visual presentation. | Very large datasets may impact page performance. |
Final Verdict
UberChart – WordPress Chart Plugin 1.35 is an excellent solution for creating responsive charts, graphs, and interactive data visualizations within WordPress. Its spreadsheet-style editor, flexible chart options, and customization capabilities make it a practical choice for businesses, educators, marketers, analysts, and developers.
Whether you’re publishing reports, showcasing analytics, presenting research, or displaying business metrics, UberChart helps transform raw data into engaging visual content that improves understanding and enhances the overall user experience.
Please note: This is a digital product. Due to its digital nature, all sales are final — no refund will be provided after purchase and delivery. Please see our Refund Policy before purchasing.